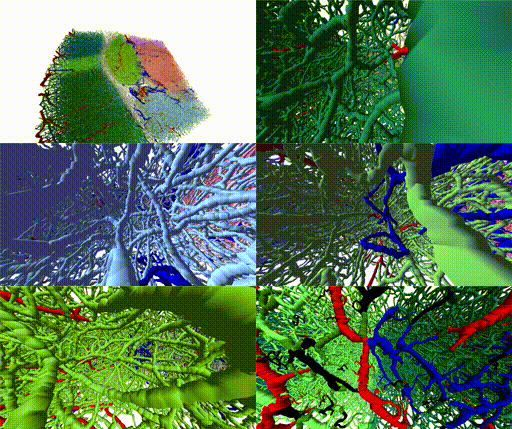
PlotGraph3d
Plotting routines for 3d display of graphs.
Note
This module is using vispy.
-
plot_graph_edge_property(graph, edge_property, colormap=None, mesh=False, percentiles=None, clip=None, normalize=None, **kwargs)[source]
-
plot_graph_line(graph, view=None, coordinates=None, color=None, edge_colors=None, vertex_colors=None, width=None, mode='gl', center_view=True, title=None, **kwargs)[source]¶ Plot a graph as 3d lines.
Arguments
- graphGraph
The graph to plot.
- titlestr or None
Window title.
- viewview or None
Add plot to this view. if given.
Returns
- viewview
The view of the plot.
-
plot_graph_mesh(graph, view=None, coordinates=None, radii=None, color=None, vertex_colors=None, edge_colors=None, n_tube_points=8, default_radius=1, mode='triangles', shading='smooth', center_view=True, title=None, **kwargs)[source]¶ Plot a graph as a 3d mesh.
Arguments
- graphGraph
The graph to plot.
- titlestr or None
Window title.
- viewview or None
Add plot to this view. if given.
Returns
- viewview
The view of the plot.

 Source


