# -*- coding: utf-8 -*-
"""
PlotGraph3d Module
------------------
Plotting routines for 3d display of graphs.
Note
----
This module is using vispy.
"""
__author__ = 'Christoph Kirst <ckirst@rockefeller.edu>'
__license__ = 'MIT License <http://www.opensource.org/licenses/mit-license.php>'
__copyright__ = 'Copyright (c) 2017 by Christoph Kirst, The Rockefeller University, New York City'
import numpy as np
import vispy
import vispy.scene
import ClearMap.Visualization.Vispy.Plot3d as p3d
import ClearMap.Visualization.Vispy.GraphVisual as gvi
import ClearMap.Visualization.Color as col
###############################################################################
### Plotting
###############################################################################
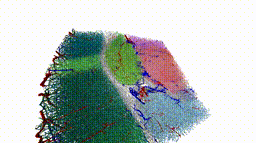
[docs]def plot_graph_mesh(graph, view = None,
coordinates = None, radii = None,
color = None, vertex_colors = None, edge_colors = None,
n_tube_points = 8, default_radius = 1,
mode = 'triangles', shading='smooth',
center_view = True, title = None, **kwargs):
"""Plot a graph as a 3d mesh.
Arguments
---------
graph : Graph
The graph to plot.
title : str or None
Window title.
view : view or None
Add plot to this view. if given.
Returns
-------
view : view
The view of the plot.
"""
# build visuals
GraphMesh = vispy.scene.visuals.create_visual_node(gvi.GraphMeshVisual)
title = title if title is not None else 'plot_graph_mesh';
view = p3d.initialize_view(view, title=title, depth_value = 100000000,
fov=100, distance=0, elevation=0, azimuth=0);
p = GraphMesh(graph, parent=view.scene,
coordinates=coordinates, radii=radii,
color=color, vertex_colors=vertex_colors, edge_colors=edge_colors,
shading=shading, mode=mode, n_tube_points=n_tube_points,
default_radius=default_radius, **kwargs);
if center_view:
view.camera.center = np.mean(graph.vertex_coordinates(), axis=0);
return p;
[docs]def plot_graph_line(graph, view = None,
coordinates = None,
color = None, edge_colors = None, vertex_colors = None,
width = None, mode = 'gl',
center_view = True, title = None, **kwargs):
"""Plot a graph as 3d lines.
Arguments
---------
graph : Graph
The graph to plot.
title : str or None
Window title.
view : view or None
Add plot to this view. if given.
Returns
-------
view : view
The view of the plot.
"""
# build visuals
GraphLine = vispy.scene.visuals.create_visual_node(gvi.GraphLineVisual)
title = title if title is not None else 'plot_graph_line';
view = p3d.initialize_view(view, title=title, depth_value = 100000000,
fov=100, distance=0, elevation=0, azimuth=0);
if width is None:
width = 1;
p = GraphLine(graph, coordinates=coordinates, color=color, vertex_colors=vertex_colors, edge_colors=edge_colors,
parent=view.scene, width=width, mode=mode, **kwargs);
if center_view:
view.camera.center = np.mean(graph.vertex_coordinates(), axis=0);
return p;
[docs]def plot_graph_edge_property(graph, edge_property, colormap = None,
mesh = False, percentiles = None, clip = None, normalize = None, **kwargs):
if isinstance(edge_property, str) and edge_property in graph.edge_properties:
edge_property = graph.edge_property(edge_property);
edge_colors = np.array(edge_property, dtype=float);
if percentiles is not None:
clip = np.percentile(edge_colors, percentiles);
if clip is not None:
lo,hi = clip;
edge_colors[edge_colors < lo] = lo;
edge_colors[edge_colors > hi] = hi;
if normalize is not None:
edge_colors -= np.min(edge_colors);
edge_colors /= np.max(edge_colors);
if colormap is None:
colormap = col.color_map('viridis');
edge_colors = colormap(edge_colors);
if mesh:
return plot_graph_mesh(graph, edge_colors=edge_colors, **kwargs);
else:
return plot_graph_line(graph, edge_colors=edge_colors, **kwargs)
###############################################################################
### Tests
###############################################################################
def _test():
import numpy as np
import ClearMap.Analysis.Graphs.GraphProcessing as gp
import ClearMap.Visualization.Vispy.PlotGraph3d as pg3
from importlib import reload
reload(pg3)
#g = gr.load('/home/ckirst/Desktop/Vasculature/Analysis_2018_03_27/stitched_graph_transformed.gt')
#g = gr.load('/home/ckirst/Science/Projects/WholeBrainClearing/Vasculature/Experiment/Graphs_2018_05/graph_reduced.gt')
g = gp.ggt.Graph(n_vertices=10);
g.add_edge(np.array([[7,8],[7,9],[1,2],[2,3],[3,1],[1,4],[4,5],[2,6],[6,7]]));
g.set_vertex_coordinates(np.array([[10,10,10],[0,0,0],[1,1,1],[1,1,0],[5,0,0],[8,0,1],[0,7,1],[0,10,2],[0,12,3],[3,7,7]], dtype=float));
gc = gp.clean_graph(g);
gr = gp.reduce_graph(gc, edge_geometry=True, edge_geometry_vertex_properties = ['coordinates'])
edge_colors = np.random.rand(gr.n_edges, 4);
edge_colors[:,3] = 1.0;
pg3.plot_graph_mesh(gr, edge_colors=edge_colors)
edge_colors = np.random.rand(g.n_edges, 4);
edge_colors[:,3] = 1.0;
pg3.plot_graph_line(g, edge_color=edge_colors)

 Source