Overview of ClearMap
ClearMap is a toolbox to analyze and register microscopy images of cleared tissue. It is targeted towards cleared brain tissue using the iDISCO+ Clearing Method but can be used with any volumetric imaging data. ClearMap contains a large number of functions dedicated to many aspects of 3D image manipulation and object detection, which could open a lot of possibilities for advanced users. For most users however, all relevant functions are explained in the tutorial in the next section, which contains a classic application case for ClearMap.
The ClearMap code package is structured into four main modules:
- IO for reading and writing images and data
- Alignment for resampling, reorientation and registration of images onto references
- Image Processing for correcting and quantifying the image data
- Analysis for the statistical analysis of the data
IO
ClearMap supports a wide range of image formats with a particular focus on volumetric data packaged as stacks or individual files:
| Format | Description |
|---|---|
| TIF | tif images and stacks |
| RAW / MHD | raw image files with optional mhd header file |
| NRRD | nearly raw raster data files |
| IMS | Imaris image files |
| pattern | folder, file list or file pattern of a stack of 2d images |
We recommend using when possible to use the pattern format, such as image-Zxxxx.tif where ‘’xxxx’’ is a number, such as 0001.
Note
ClearMap can read the image data from a Bitplane’s Imaris, but can’t export image data as an Imaris file.
Images are represented internally as numpy arrays. ClearMap assumes images in arrays are arranged as [x,y], [x,y,z] or [x,y,z,c] where x,y,z correspond to the x,y,z coordinates as when viewed in an image viewer such as [ImageJ] and c to a possible color channel.
ClearMap also supports several data formats for storing data points, such as cell center coordinates or intensities:
| Format | Description |
|---|---|
| CSV | comma separated values in text file, for exporting to other programs |
| NPY | numpy binary file, faster and more compact format for the point data |
| VTK | vtk point data file, for exporting to some programs |
| IMS | Imaris data file, for writing points onto an existing Imaris file |
points files simply contain all point coordinates arranged as an array of [x,y,z] coordinates where each line is a detected cell center. intensities files are companion to point files (only for csv and npy formats), where each line contains informations about intensity and detected size for the corresponding center in the point file. Each line in the array of the intensities file has 4 rows organised as follows:
| Row | Description |
|---|---|
| 0 | Max intensity of the cell center in the raw data |
| 1 | Max intensity of the cell center after the DoG filtering. |
| 2 | Max intensity of the cell center after the background subtraction |
| 3 | Cell size in voxels after the watershed detection |
Alignment
The Alignment module provides tools to resample, reorient and register volumetric images in a fast parallel way.
Image registration is done by interfacing to the [Elastix] software package. This package allows it to align cleared mouse brains onto the Allen brain atlas [ABA].
Image Processing
ClearMap provides a number of image processing tools with a focus on the
processing of large 3D volumetric images in parallel. For the detection of objects in 3D, ClearMap has a modular architecture. For the user, this is hidden and handled automatically by the detectCells function (see the example script).
The main processing modules include:
| Module | Description |
|---|---|
BackgroundRemoval |
Background estimation and removal via morphological opening |
IlluminationCorrection |
Correction of vignetting and other illumination errors |
Filter |
Filtering of the image via large set of filter kernels |
GreyReconstruction |
Reconstruction of images |
SpotDetection |
Detection of local peaks |
CellDetection |
Detection of cell centers |
CellSizeDetection |
Detection of cell shapes via watershed |
IlastikClassification |
Classification of voxels via interface to [Ilastik] |
The modular structure of this sub-packages allows for fast and flexible integration of additional modules for future developments.
Analysis
This part of ClearMap provides a toolbox for the statistical analysis and visualization of detected cells or structures and region specific analysis of annotated data.
For cleared mouse brains aligned to the [ABA] a wide range of statistical analysis tools with respect to the annotated brain regions in the atlas is supported. Two types of analysis are done:
- Voxel statistics, which are based on the heat-map generated from the detected cell centers. These are usually represented as image stacks of mean, standard deviation, p-values with False Discovery Rate options.
- Region statistics, which are based on the annotated regions from the reference annotation file. They are usually represented as spreadsheets containing the statistics for each region.
The Key modules are:
| Module | Description |
|---|---|
Statistics |
Statistical tools for the analysis of detected cells |
Voxelization |
For voxel-based statistics: voxelization of cells for visualization and analysis |
Label |
For region-based statistics: tools to analyse data with the annotated reference files |
The use of the modules is explained in the tutorial.
iDISCO+ Clearing Method
Robust quantification of 3D datasets requires images as uniform as possible for the signal properties, both on each plane, and also at all imaging depths. The iDISCO+ method is an evolution of the iDISCO whole-mount labeling technique to improve the diffusion and background of staining in large samples [Renier2014], and the 3DISCO clearing technique [Erturk2012]. The iDISCO+ staining and clearing method is combined optimally with the very large field of view enabled by light sheet microscopy, in particular the ultramicroscope optical design, which enables low magnification imaging with high speed and relatively high resolution.
- The datasets used to develop ClearMap are usually composed of two channels:
- The signal channel. Typically obtained in the far-red light spectrum, where the optical properties of the cleared tissue are at their best for signal-to-noise and transparency. It is recommended when possible to use nuclear reporters or proteins to facilitate the object detection.
- The autofluorescence channel, usually collected in the blue-green light spectrum. The background tissue fluorescence highlights the major structures of the tissue to facilitate the 3D image registration. Only the contrast between regions is important here, so it doesn’t matter if the relative intensities between regions are not the same as on the reference scans.
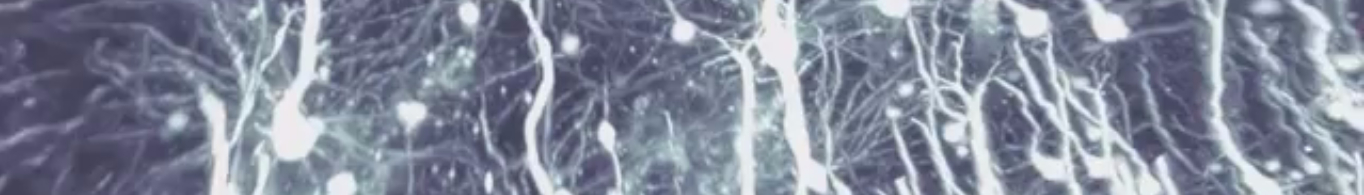
- See these videos for example of light sheet imaging of cleared tissues:
More info can be found on the [iDISCO] webpage.
References
| [Erturk2012] | Three-dimensional imaging of solvent-cleared organs using 3DISCO.iDISCO: A Simple, Rapid Method to Immunolabel Large Tissue Samples, A. Erturk, et al. Nat. Protocol 2012 |
| [Renier2014] | iDISCO: A Simple, Rapid Method to Immunolabel Large Tissue Samples for Volume Imaging, N. Renier, et al. Cell 2014 |
| [Renier2015] | ‘Mapping brain activity in the mouse at cellular resolution with volume imaging using immediate early genes, N. Renier, et al. in prep. |
| [iDISCO] | `iDISCO webpage, http://idisco.info/ < http://idisco.info/>`_ |
| [ABA] | (1, 2) Allen Brain Atlas, http://www.brain-map.org/. |
| [Elastix] | Elastix toolbox for rigid and nonrigid registration of images, http://elastix.isi.uu.nl |
| [Ilastik] | Ilastik the interactive learning and segmentation toolkit, http://ilastik.org/ |
| [ImageJ] | ImageJ |